Contributors
Subscribe to our newsletter
Written by: Jason Lupoi, Ph.D.
Geochemists exploring potential hydrocarbon production from source rock must be able to accurately predict the type and relative abundance of each type of hydrocarbon that is present prior to investing resources in the material’s extraction. Many chemical and physical factors contribute to hydrocarbon formation, so hydrocarbon predictions are typically a complex assessment of several source rock characteristics. Temperature and time are major factors in hydrocarbon generation. Therefore, a widely-used parameter, termed thermal maturity, is measured to assess the extent to which temperature has altered the organic matter throughout the rock’s geologic history.1-3
The thermal maturity of coal has been accurately measured using optical microscopy to assess the coal macerals, particularly vitrinite. Vitrinite is one type of organic component within kerogen – the solid, organic matter in sedimentary rocks and the source of petroleum or natural gas generated from the geological heating of the rock. As the subsurface temperature increases, vitrinite undergoes chemical transformations that increase the amount of reflected light optically measured.4,5 Vitrinite reflectance (VRo) is widely used by geochemists to predict the thermal maturity of coal and has been for more than 80 years.
However, the application of VRo to source rocks that contain less than 5% carbon is considerably more challenging. It requires a very skilled and experienced petrographer to ensure only vitrinite is measured. It requires sizeable amounts of sample and time-consuming sample preparation, making it ill-suited to provide expedited results required to make real-time business decisions.
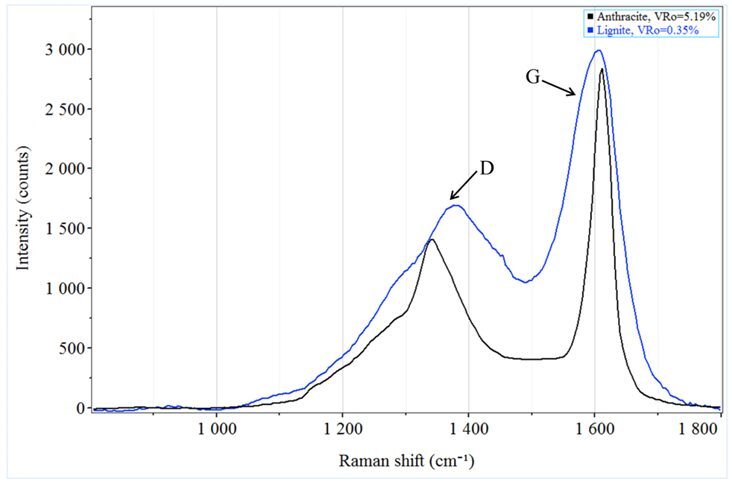
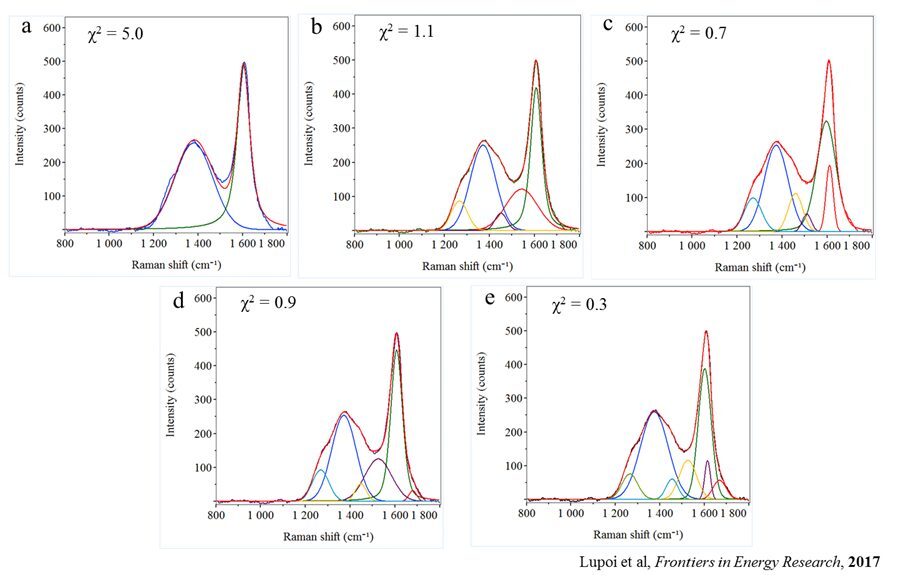
Raman spectroscopy offers a different approach, using scattered laser light to generate qualitative and quantitative information from the carbon-carbon bonds, making coal and shale particularly well-suited for the generation of Raman spectra. Analysis of these rocks produces two main Raman peaks, a D-band that is generated by disordered carbon and a G-band that is indicative of the graphitic carbon in the sample (Figure 1). Since these bands may contain one or more spectral peaks each, spectral deconvolution (peak-fitting) is necessary to determine thermal maturity. The presence of other known ancillary peaks within D- and G-bands can introduce subjectivity (Figure 2) to the analysis of thermal maturity.6 Each of these spectral fits leads to a different assessment of the thermal maturity.
Multivariate analysis (MVA) of the Raman data removes the subjectivity introduced by spectral deconvolution. Mathematical algorithms have been developed to model the correlation between VRo and Raman spectral data and to provide statistical assessments of the model’s accuracy and validity. The calibration model is applied to the Raman spectra of uncharacterized samples to measure the sample’s thermal maturity. It is more sensitive than vitrinite reflectance and can easily assess shale samples with low concentrations of carbon. The technique requires very little sample prep and can be applied to very small samples, including drill cuttings. It provides rapid and timely results and has the potential to allow those involved in the exploration and production of hydrocarbons from source rocks to make quicker, more informed decisions. RJ Lee Group’s use of Raman Spectroscopy and multivariate analysis to provide accurate thermal maturity predictions for a geographically diverse set of more than 40 coal samples is the subject of a 2018 publication.7 This method was extended to the analysis of thermal maturity in shale in a recent publication.8
References
1 Dow, W.G. (1977). “Kerogen studies and geological interpretations,” Journal of Geochemical Exploration, 7, 79-99.
2 Taylor et al., (1998). “Organic Petrology,” Berlin and Stuttgart: Gebruder Borntraeger.
3 Suárez-Ruiz et al., (2012). “Review and update of the applications of organic petrology: Part 1, geological applications,” International Journal of Coal Geology, 99, 54-112.
4 McCarthy et al., (2011). “Basic Petroleum Geochemistry for Source Rock Evaluation,” Oilfield Review, 23(2): 32-43.
5 ASTM (2015). “D 7708 Standard test method for microscopical determination of the reflectance of vitrinite dispersed in sedimentary rocks, petroleum products, lubricants, and fossil fuels; gaseous fuels; coal and coke,” West Conshohocken, PA: ASTM International.
6 Lupoi et al. (2017). “Assessment of thermal maturity trends in Devonian-Mississippian source rocks using Raman spectroscopy: limitations of the peak-fitting method,” Front Energy Res, 5(24), open access.
7 Lupoi et al., (2018). “Quantitative evaluation of vitrinite reflectance and atomic O/C in coal using Raman spectroscopy and multivariate analysis,” Fuel, 230, 1-8.
8 Lupoi et al., (2019). “Quantitative evaluation of vitrinite reflectance in shale using Raman spectroscopy and multivariate analysis,” Fuel, 254, 115573.
This summary description is offered for educational purposes only and no warranty (express or implied) is given on the applicability of this information to any particular part, material, application, or product. This article is not intended to be a complete dissertation on this topic and the reader is encouraged to contact RJ Lee Group for consultation regarding individual applications, materials, or situations.
Applicable RJLG Services
Raman Spectroscopy
X-ray Diffraction (XRD)
X-ray Fluorescence (XRF)
CCSEM
Polarized Light Microscopy (PLM)
Particle Sizing
Mineral Identification